

Microsoft Power BI is one of the components of the Microsoft Power platform, along with Microsoft Power Apps, Microsoft Power Automate and Microsoft Power Pages. The core functionality of the application is to visualize data from a variety of sources.
Do you have an overview of the performance of all branches? Can you evaluate the reasons for your customers’ complaints? Can you visualise key sales figures that are critical to success, broken down by region and time period? No? Don’t worry, it doesn’t have to stay that way.
Then let us change that. Your data is probably currently scattered in various sources and you lack an overview. Making well-founded decisions is thus only possible with difficulty or costs an enormous amount of time.
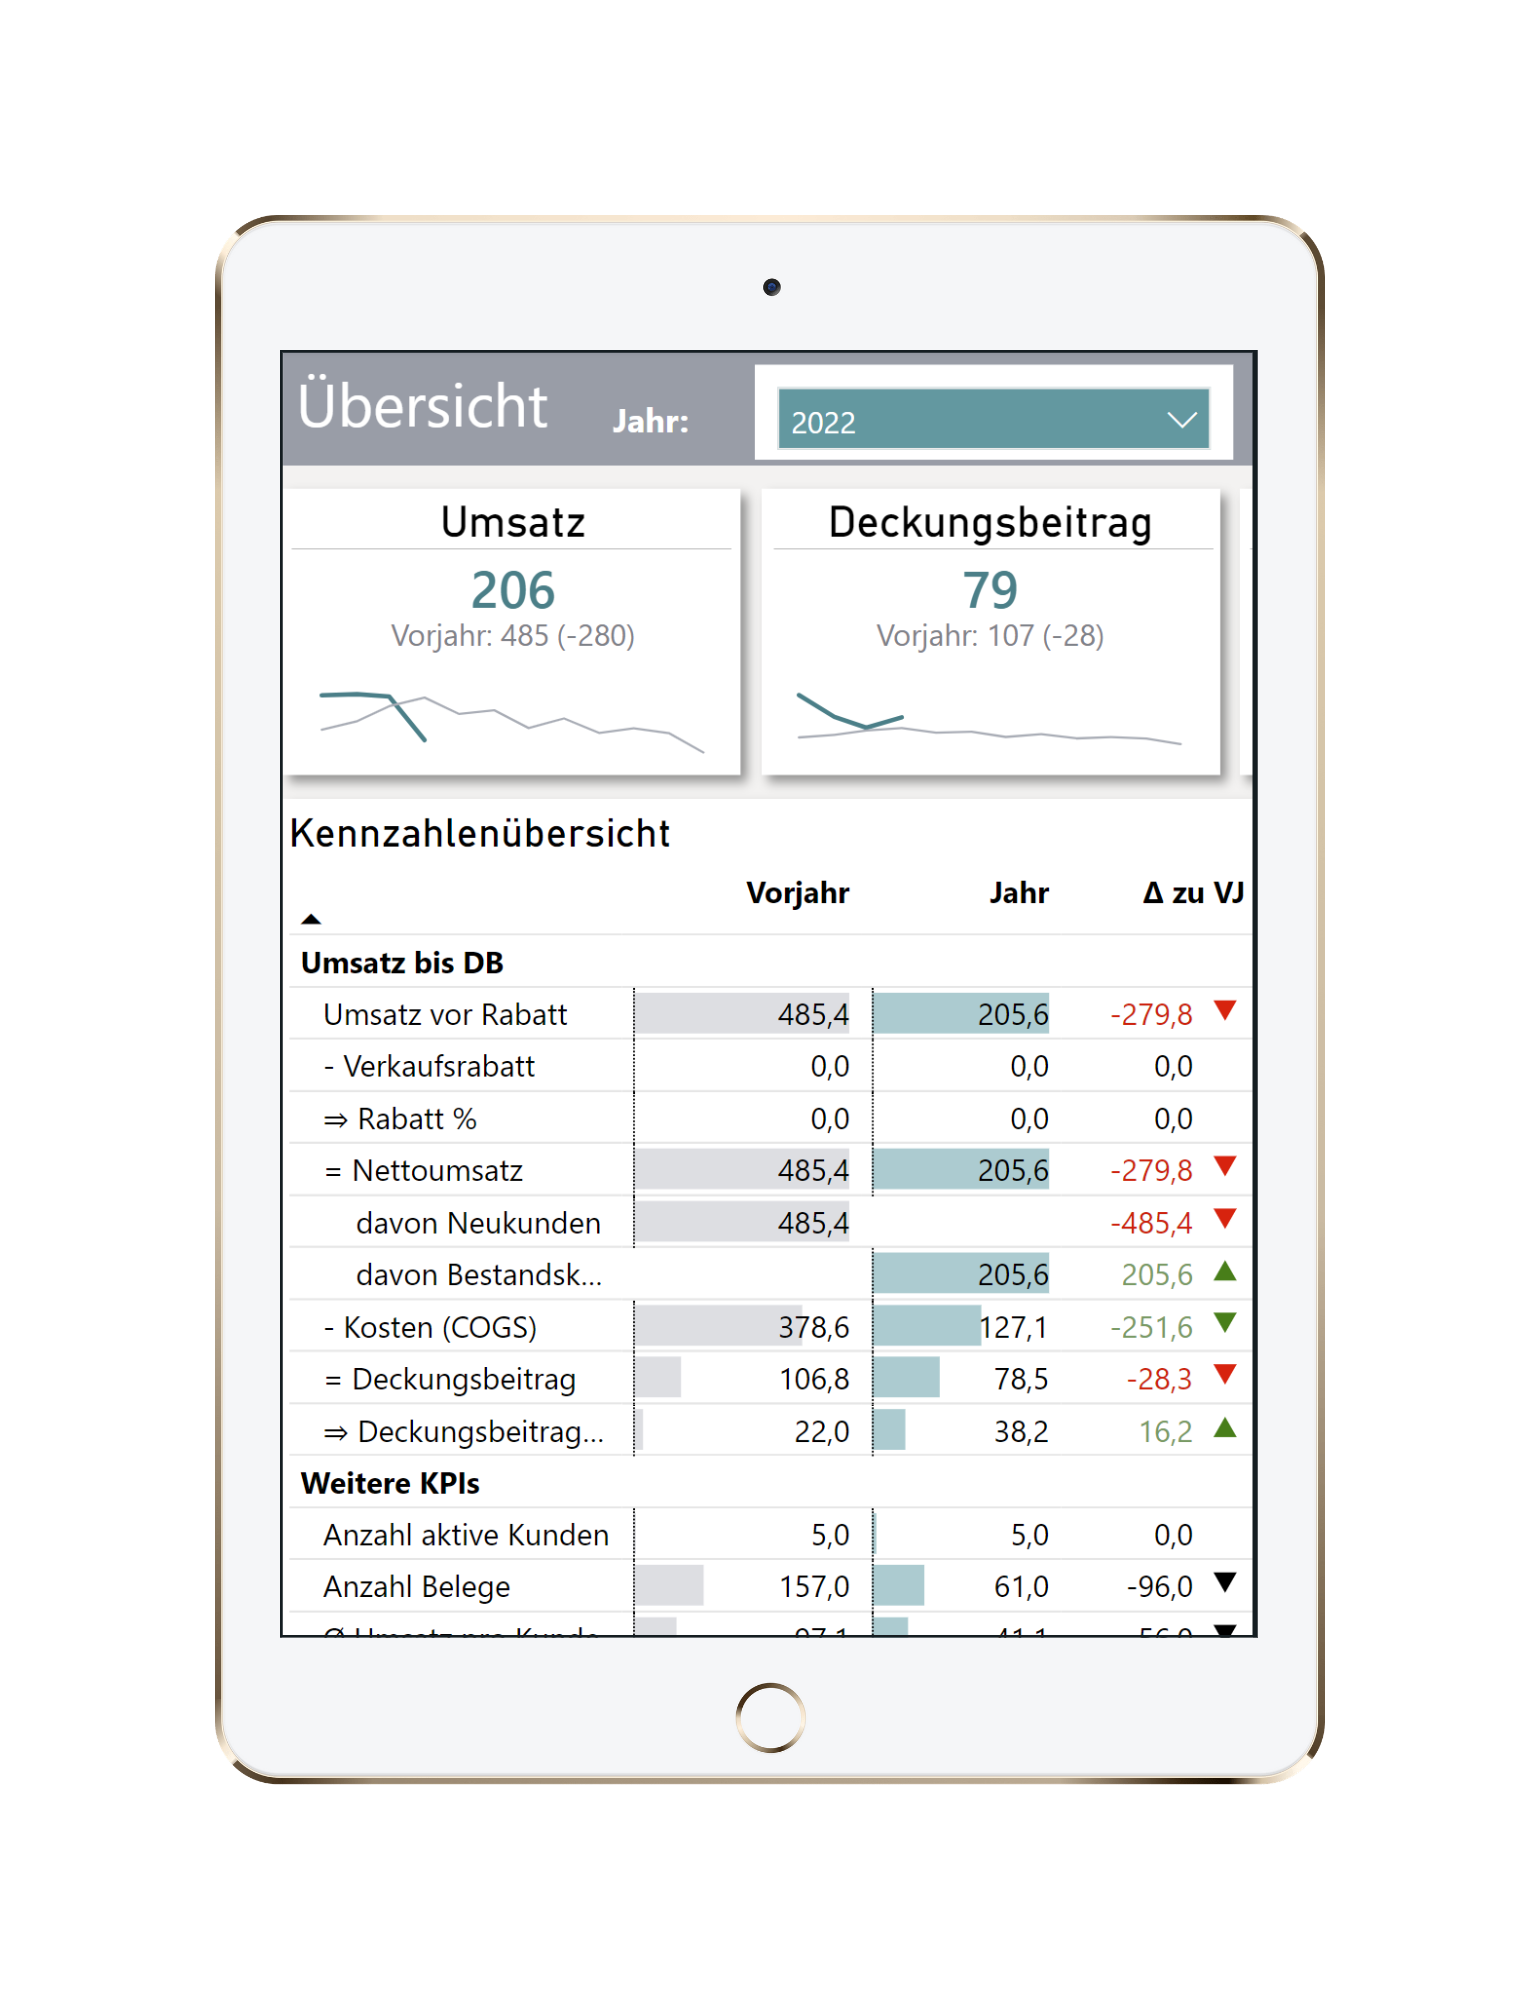
Microsoft Power BI is an interactive business intelligence tool for data visualisation. It enables you to keep an eye on all important developments in your company at all times. You can easily build clear live dashboards and reports based on a variety of data sources and easily control your company. Even from your smartphone. In this way, you resolve the inefficiencies of isolated data sets and can take targeted action more quickly.
It’s easy to use: if you are looking for specific data, you can ask a question in natural language in Microsoft Power BI and the software will suggest visualisations. You can also use your existing data, forecasts and trends. What more could you want?

Mit dem Laden des Videos akzeptieren Sie die Datenschutzerklärung von YouTube.
Mehr erfahren
Power BI can be used for a wide variety of scenarios. We have put together some use cases for you. Can you find your situation in an example?
As a managing director, it is certainly important to you to increase your market share and to grow as a company. With the help of Power BI, you can align your Dynamics 365 Business Central or Dynamics NAV dashboard in such a way that your favorite success-critical key figures (e.g. development of market share, sales, mood, competition) are visualized broken down by region and period.
In the standard version of Dynamics 365 Business Central or Dynamics NAV, it is not possible to make cross-tenant evaluations – for example, across several branch offices.
With the help of Microsoft Power BI this problem can be solved without programming in Dynamics NAV or Dynamics 365 Business Central. Finally, in Power BI – unlike the standard – data of all clients can be merged and a company-wide evaluation can be made. For example, orders on hand or sales can be evaluated according to postcodes and displayed using a variety of display options (e.g. table, map).
Microsoft Power BI makes the causes of problems quickly visible – for example when analyzing the reasons for complaints. It may turn out that the complaint rate for a product is particularly high compared to other products – because the article was used more than average or because the material is prone to errors?
Power BI makes it easy for you to find out – even where the article in question is installed.
As a human resources manager, it will be close to your heart to track key performance indicators that are critical to success. Use Power BI to generate analyzes – for example, of the number of new hires compared to the previous year, by gender, by age or by percentage development.
As a warehouse manager, you certainly want to monitor the most important warehouse key figures. Generate reports on your spend, supplier discount usage by region, city, month or category.
This allows you to answer questions such as:
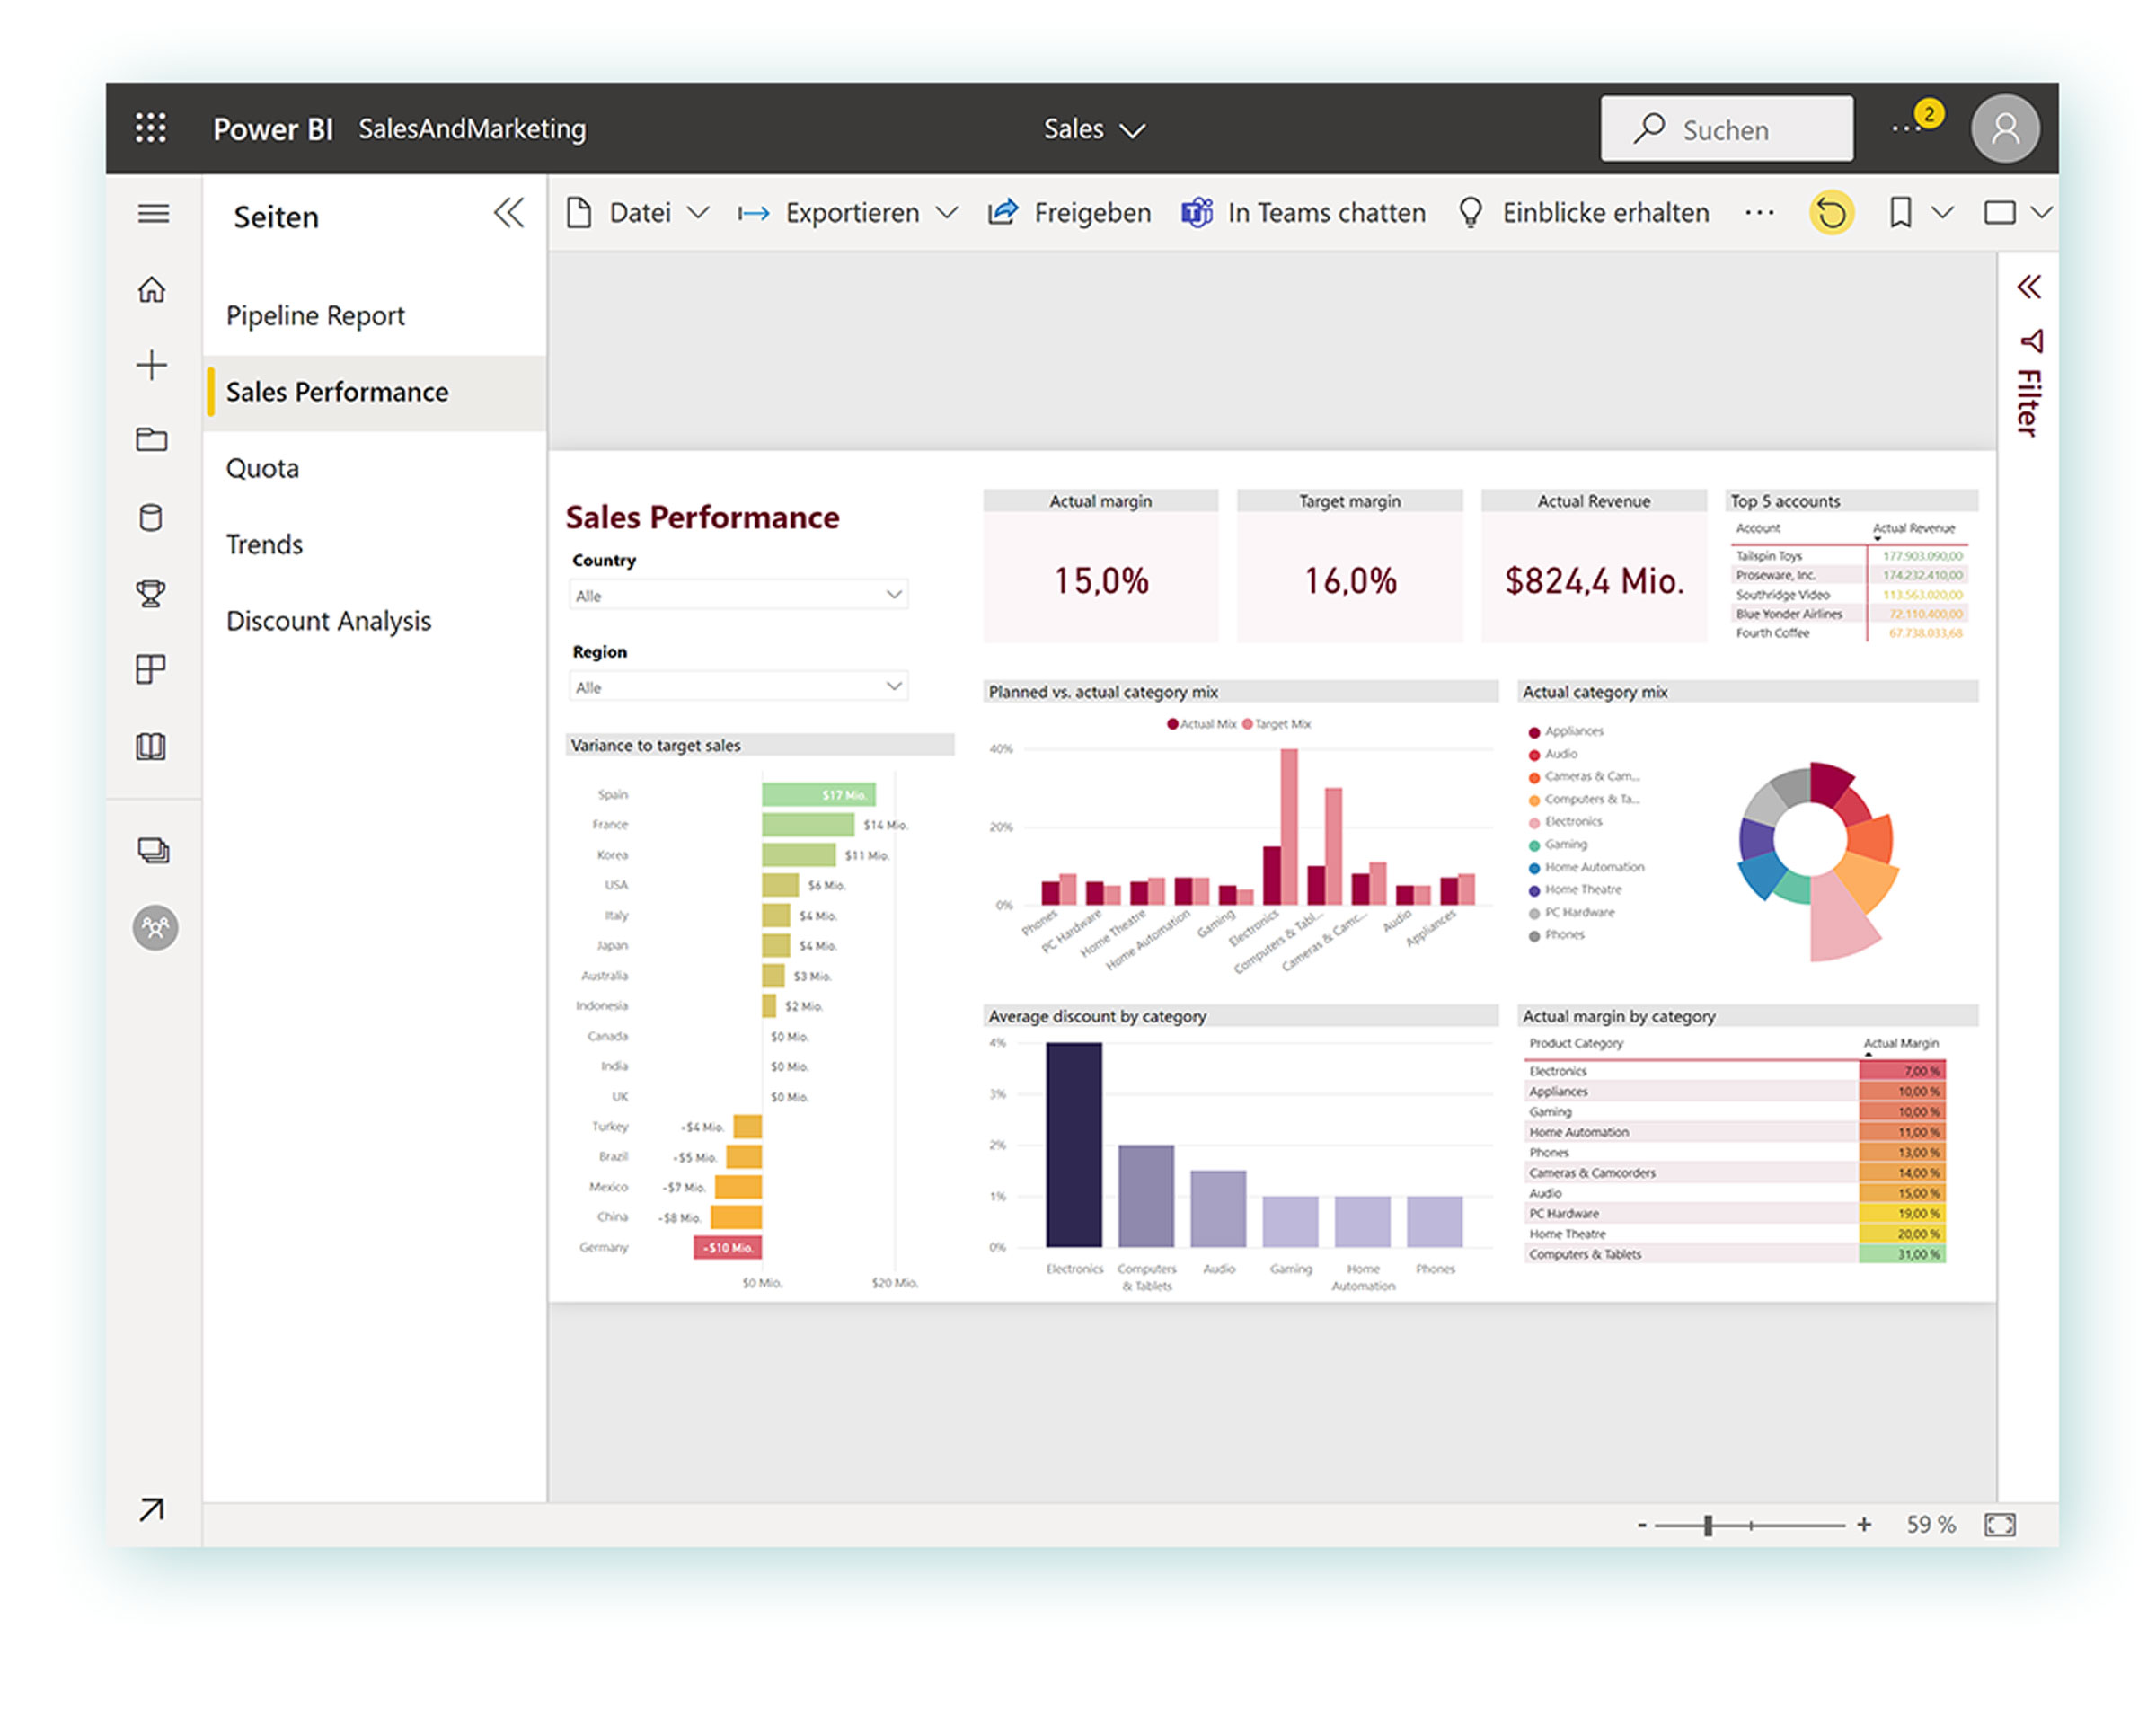
In addition, Microsoft Power BI can be used for excellent sales management. For example, a map of Germany with information on target and actual sales figures in the dashboard could be integrated into Dynamics 365 Business Central or Microsoft Teams for every sales person in a company. In this way, they can see at any time when they are performing and how, and where they still need to take action.
Of course, settings such as visibility, i.e. whether each salesperson is also allowed to see how his colleagues are performing or only see his figures, can be controlled.


Options to visualise
Create comprehensive tables, interactive diagrams and easily integrate map services. You can also share these with the team.

Many data sources
You can link data from many different tables (e.g. stock value and item price). You are not limited to one application.

Great action basis
You keep an eye on developments and immediately recognize when action is required. This makes it easier for you to make decisions and convince others.

„It is of interest to us to know how often which variant combinations (case and bracelet) are sold. Likewise, incoming orders by country are important. Through Power BI, our evaluation needs have been solved. Minimal adjustments were made so that we now finally have the possibility to see which variant combinations have achieved which sales/turnover in which countries.“
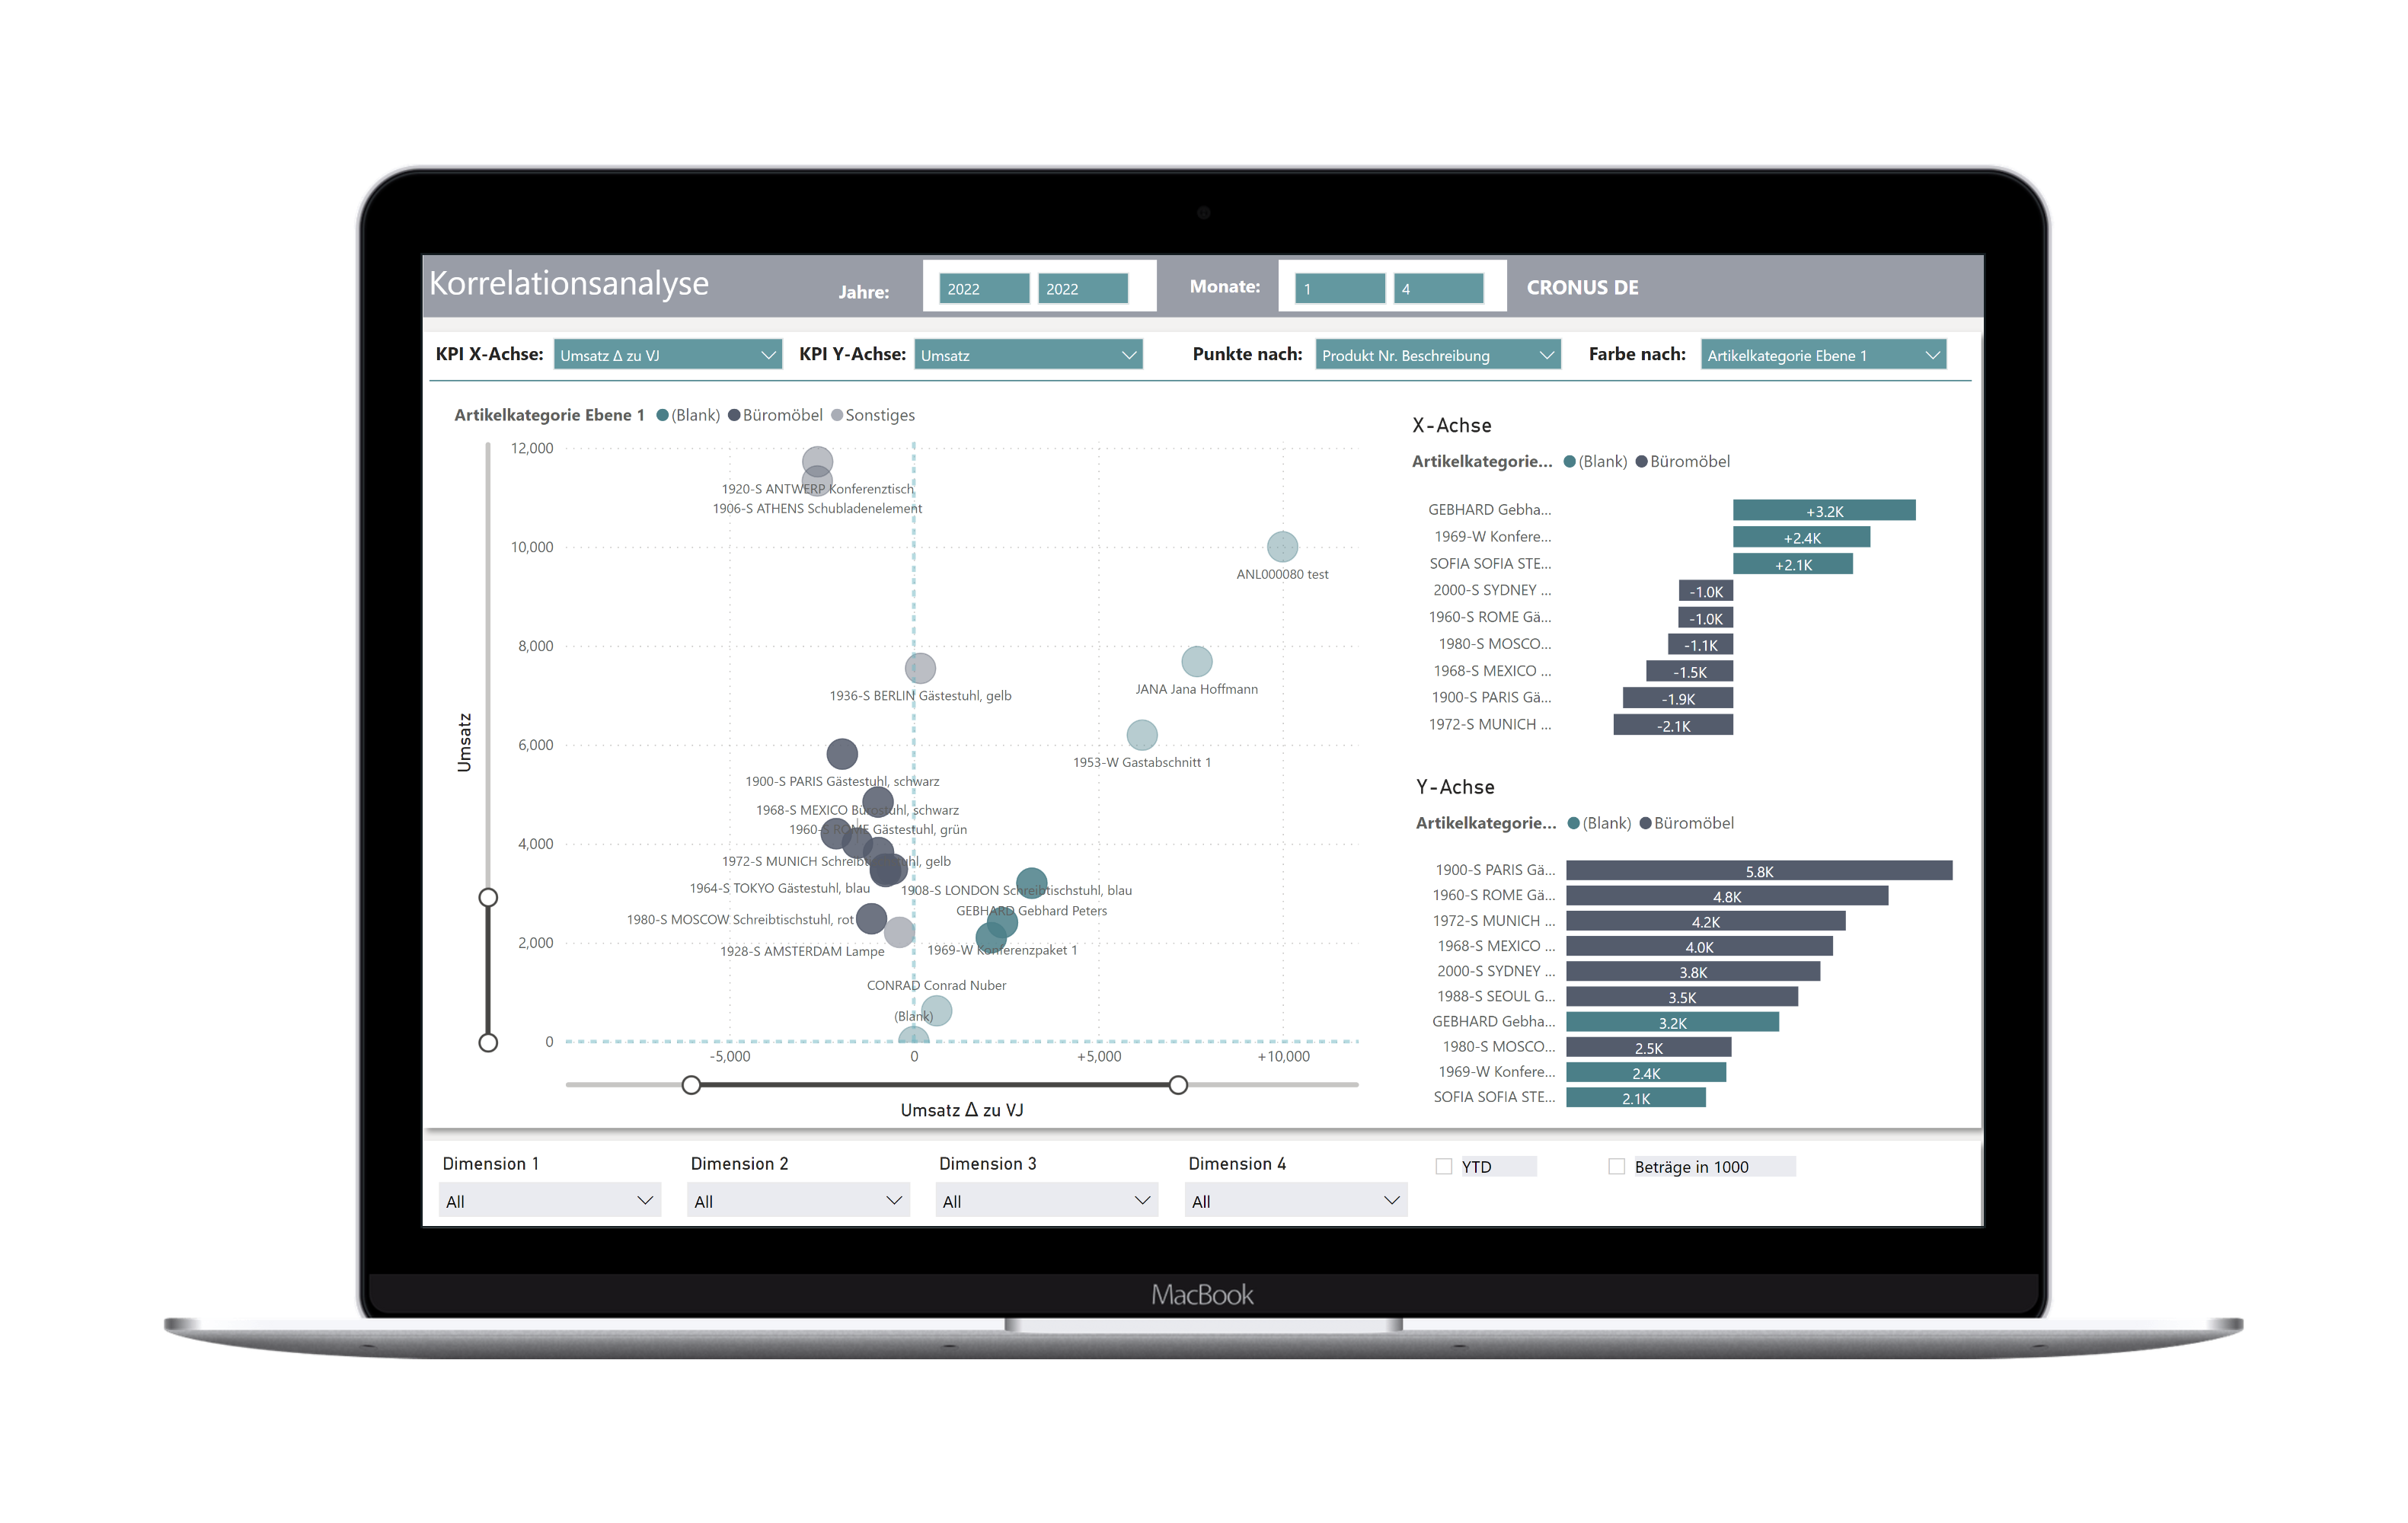
With the help of classic dashboards and targeted analyses, you can uncover causes, recognize correlations, understand changes and identify trends. Through our cooperation with our partner navida, we offer you ready-made Power BI templates. Fully integrated in Dynamics 365 Business Central/Dynamics NAV. Together we offer you three packages or tools for Dynamics 365 Business Central: Finance, Sales, Purchasing.
If you are interested, please contact us.
With Microsoft Power BI, you can visualize your data in a variety of display options (e.g., dashboard of company performance, target and actual sales figures). Consolidate data from disparate data sources and reduce manual activities. Merging data from a wide variety of sources, in particular, resolves the inefficiencies of isolated data sets.
It also allows you to identify action items more quickly and take more targeted action by sharing with your team or other departments or management.
Power BI Desktop is a free application that you can install on your local computer. It allows you to connect to your data across multiple data sources on your desktop, combine them into your data model, and visualize them (collectively, modeling). Updates to your visualizations are available at the click of a button (not automatically). Note that sharing with colleagues is not possible within Power BI Desktop.
The price of Power BI depends on the selected feature set and subscription term. You can choose between Power BI Desktop (free of charge), Power BI Pro (from 8,40 € /month/user and Power BI Premium (from 16,90 € /user/month).
You can find a price and feature overview on our pricing page.
Yes, Power BI Desktop is a free application.
Power BI is not included across the board in Office 365. Only Power BI Pro is included in Microsoft 365 E5. An overview of licensing options can be found on our pricing page.
Self-Service-BI is easily possible with prefabricated standard tables. However, complex requirements that go beyond these standard tables can only be done by spending a lot of time and effort without relevant experience.
We advise you to weigh effort and benefit and to look for a competent and experienced Microsoft partner company for your first complex Power BI project. This way you will reach your goal, which is the desired data visualization, and on top of that you will learn how to handle Microsoft Power BI yourself.
Yes, you can. In order to use Power BI with your local Microsoft Dynamics NAV environment, you first need to enable the OData service for the web service. The OData feed is used to provide the data basis from the SQL Server. Which data is available can be checked under the item “Web Services” in the client. There you can also find the OData feed URL that Power BI needs to query the data. Initially, only the object type “query” is relevant for Power BI. In the standard system, many queries are already available, such as a listing of all sales orders by sales person. However, you can also create your own queries in the development environment within a few clicks. These newly created queries must then be created in the web services before you can start.